Posts

Why Every Power BI Data Analyst Needs a Calendar Table (And How to Create One)
Image
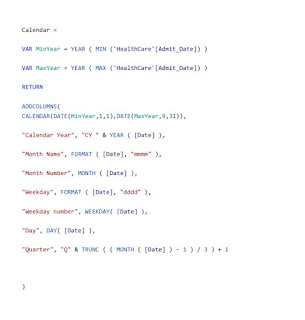
As a Power BI Data Analyst, having a robust calendar table is absolutely essential. Whether you're performing advanced time-based calculations or managing period-specific metrics like Year-To-Date (YTD), Month-To-Date (MTD), or Week-To-Date (WTD), a well-constructed calendar table will be your go-to tool. It helps you efficiently handle time intelligence, improving both the accuracy and scalability of your reports. Without a proper calendar table, managing time-sensitive data becomes cumbersome, especially when you're dealing with complex date-based KPIs in various industries. The good news? Creating a calendar table is straightforward, and you can do it using DAX in Power BI. Here’s the DAX code to create a calendar table in Power BI: This DAX formula will help you create a dynamic and flexible calendar table that you can use for various time-related calculations in your Power BI models. Need the code in an easy-to-share format? Download the PD...

Overcoming Challenges in Creating Calendar Tables in Power BI

Image
When it comes to crafting calendar tables in Power BI, users often face a range of hurdles that can complicate their data analysis journey: Navigating Multiple Date Columns: Having multiple date columns within a single table can make it challenging to accurately determine the minimum and maximum dates needed for a cohesive calendar. Limitations of MIN and MAX Functions: Relying solely on MIN and MAX dates to generate a Calendar table can create significant issues. This approach restricts comparisons, such as evaluating current sales against those from previous months, since the Calendar table will be limited to the specified date range. Cumbersome Time Intelligence Activation: Initiating Time Intelligence features under specific conditions can be tedious and inefficient when using traditional methods. Fortunately, these challenges can be effectively resolved by leveraging BRAVO , a powerful open-source tool meticulously designed to streamline the creation of Calen...

TOPN

Image
Finding the top Nth largest or smallest data from a result set is a common request we receive in our everyday work as data analysts. Those N-values at the top or bottom of the list have a lot of power, which could help with their potential interpretations. Consider the hundreds of goods you might have in your business. You must be aware of which products are most popular and which are underperforming as a businessperson. You can guarantee your business growth with that knowledge. Making business choices will be simpler for you if you are familiar with the best-selling products. The TOPN() dax function in DAX has the best and simplest solution for your issue. My PBIX file on it contains more details, which you can read. PBIX file link: TOPN

COUNT

Image
One well-liked data analysis function is count. It is something that a data analyst must employ frequently. While working with various counts, there may occasionally be some confusion. By briefly describing its type and definition in this PBIX file, I try to capitalize on the uncertainty that has arisen. The pbix file link: COUNT